Charting the Course: Exploring the BTC Halving's Ripple Effects
The impact on flows from the halving itself is unlikely to be a significant driver for the BTC price action. That said, Bitcoin halving events tend to occur during key monetary policy turning points, so the narrative fit is just too perfect to assume they cannot influence prices.

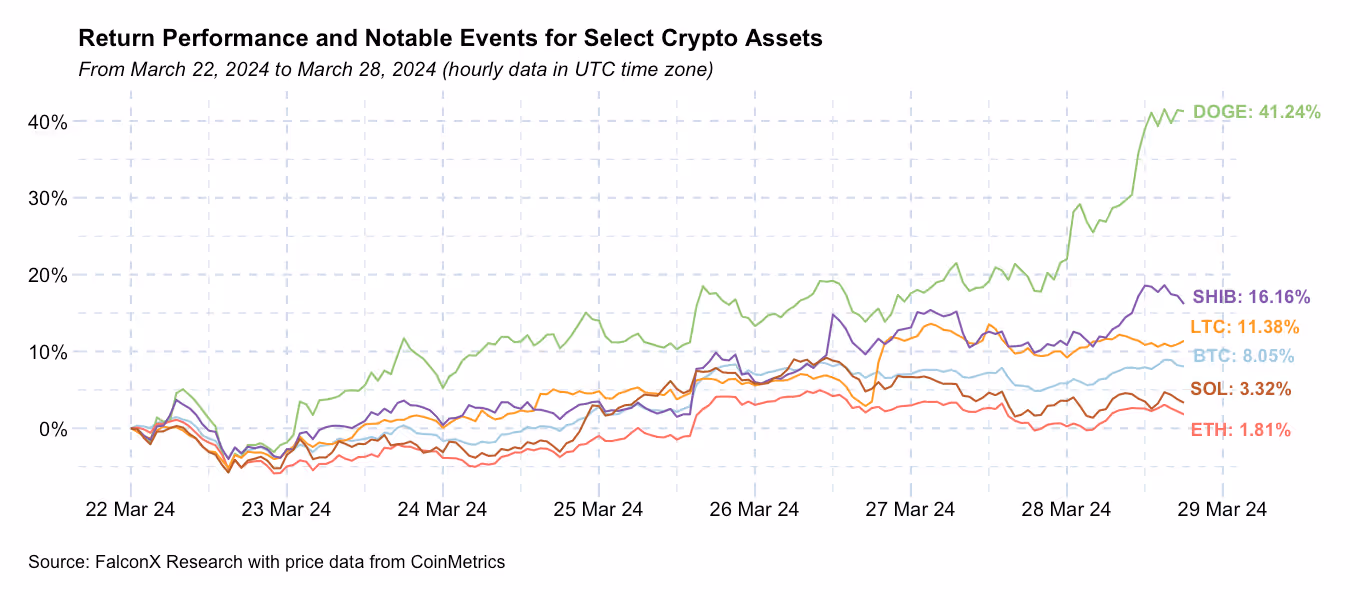
As expected, the crypto market recovered over the past week from the mid-March correction, with BTC again hovering around the $70k level. A relatively strong streak of net outflows, likely related to bankruptcy proceedings, was reversed over the past few days and put us back into net inflow territory. The underlying liquidity context also remains strong, as half of BTC’s top 20 daily trade volume days printed this month.
Most of the other non-BTC assets also recorded positive gains, with SOL and ETH flattish, but DOGE and SHIB are still going strong, indicating that the memecoin crazy still has steam.
An increasingly common topic of conversation is the Bitcoin halving, which is fast approaching around April 20. The typical argument is that the 50% reduction in new supply has historically led to gains over the following months, and many wonder whether history will repeat this time.
As I will show with data, the impact on flows from the halving itself is unlikely to be a significant driver for the BTC price action. That said, Bitcoin halving events tend to occur during key monetary policy turning points, so the narrative fit is just too perfect to assume they cannot influence prices.
Let’s unpack this.
Although miners are extremely important players in several parts of the Bitcoin ecosystem, their impact on price formation has diminished markedly over time.
The chart below shows the proportion of total mining revenue versus BTC spot traded volume (on trusted exchanges) since 2012, with the three halving dates annotated. While total mining revenue represented multiples of the daily traded volume in 2012 and a double-digit percentage in 2016, this impact has been shrinking significantly over time. Note that the y-axis is on a logarithmic scale, meaning the decrease is stronger than it might seem at first glance.
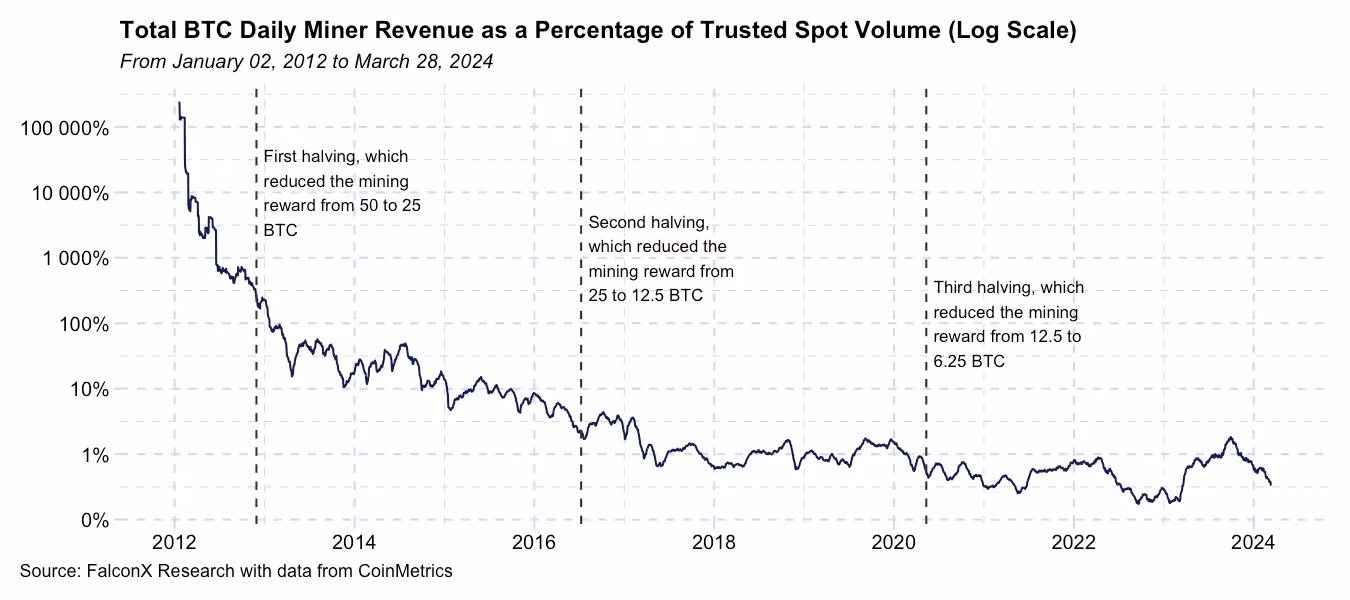
Even this analysis is an upper-bound estimate of the importance of miner flows in the BTC price formation process, as it comprises all mining revenue (and not only the portion impacted by the halving) and implies that all mined BTC is sold on exchanges, which is not the case.
Does this mean the halving will not matter for BTC over the upcoming months as it did over the past three cycles?
This is where things get interesting.
Halving events serve as the ultimate demonstration of Bitcoin's premier immutability assurance: Its 21 million supply cap. In a curious turn of events, halvings are also taking place during a time when traditional monetary policy is revealing its vulnerabilities. This juxtaposition helps elucidate the Bitcoin core investment case to a broader spectrum of investors.
In 2020, these concerns revolved around what Paul Tudor Jones called “The Great Monetary Inflation” in the essay that opened the gates for mainstream macro investors to consider the Bitcoin investment thesis. I’d argue that this was a more important factor in the 2020-2021 bull run than the direct flow impact from the halving.
Now in 2024, the concerns center around the aftermath of the fiscal/monetary policies that have been in place for decades but are getting turbocharged in a world that is very different from four years ago.
We are potentially entering a new leg of this macroeconomic cycle. As we highlighted before, macro is becoming a more important factor in crypto price action.
Recent inflation indicators are starting to show how difficult the final phase of taming inflation can be. It’s one thing to go from 6-7% to 3-4%, but the challenge of going down to 2% is at another level.
At the same time, we’re seeing many of the most important central banks around the globe shifting stances. The BoJ, the poster child of negative interest rates and unconventional asset purchases, is taking steps to normalize its heterodox policies. On the other hand, the PBOC is injecting liquidity to alleviate China’s economic woes, and the latest Fed signals led the always-great Mohamed El-Erian to affirm that the age of strict inflation targeting has ended.
Even if the short term can be rocky, it’s hard to imagine a better macro setup for Bitcoin in the medium and long terms.
The relationship between BTC and inflation over the years has taught us that BTC is uniquely suited to provide a hedge against the exhaustion of traditional mechanisms to fight inflation. It is not a typical inflation hedge like other commodities and financial assets can be.
Even if the direct price impact from the halving is not as meaningful as it once was, Bitcoin flexing its immutability muscle during a macro setup in which its raison d’etre shines the brightest makes me bullish.
Other Top Trends We're Watching
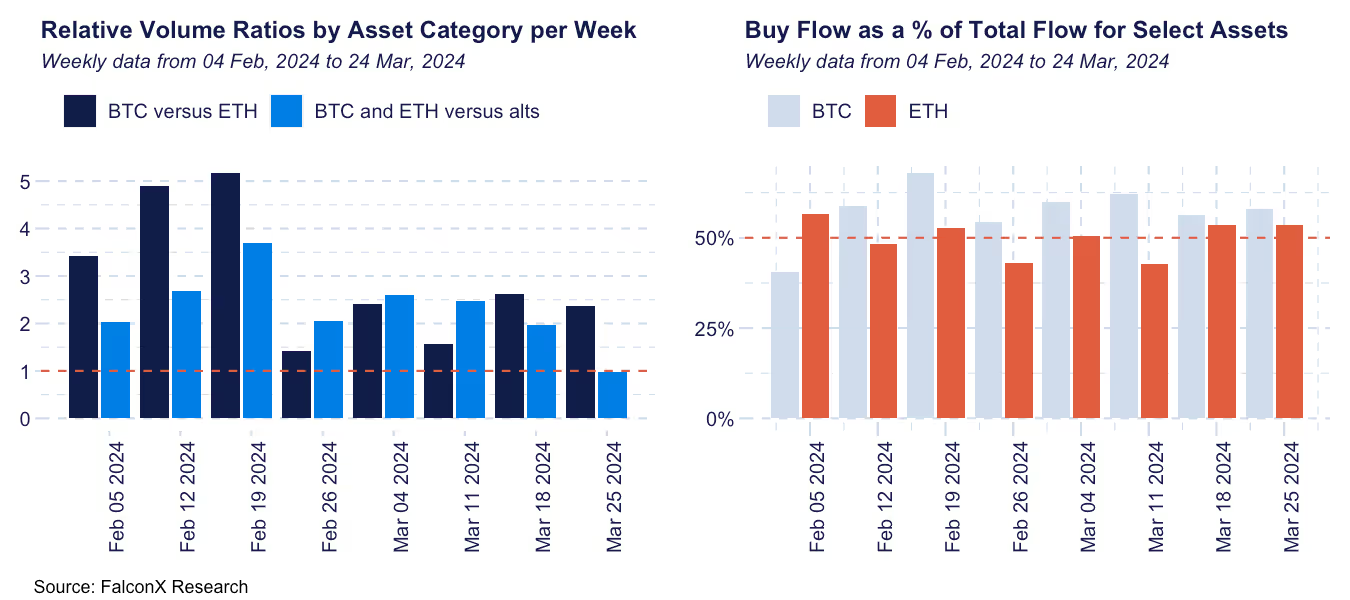
FalconX Trading Desk Color: Flow from most investor personas came in split roughly 50/50, except for BTC ETF flows that remain 100% on the buy side. Some have been slightly more buyers and others more sellers. BTC continues to draw significant attention, as it traded over 2x more than ETH, but interest in ETH and SOL remains significant. Interest in alts varied by investor persona, with the highlights including AVAX (50% buy flow), DOGE (51% buy flow), and NEAR (60% buy flow).
Could the Negative CME Basis Differential Between BTC and ETH Imply and Active ETF Basis Trade? The increasing difference between the BTC and ETH basis in CME futures contracts has attracted our interest for many months because it shows to what extent institutions have incorporated the ETH staking yield in the crypto pricing process.
The rationale is simple: Given that ETH now derives a native yield and BTC does not, the difference between the BTC and the ETH basis should approximate this yield because it reduces the futures contract carry cost.
The chart below shows how the BTC minus ETH basis, negligible until the Merge was activated in September 2022, has been progressively approaching the ETH staking yield of 3% to 5% across the maturity curve.
However, after the spot BTC ETF launches, this trend broke down for the short end of the curve (i.e., blue line), where most of the market liquidity is concentrated. This week, the BTC basis was lower than the ETH basis for the first time since mid-2022.
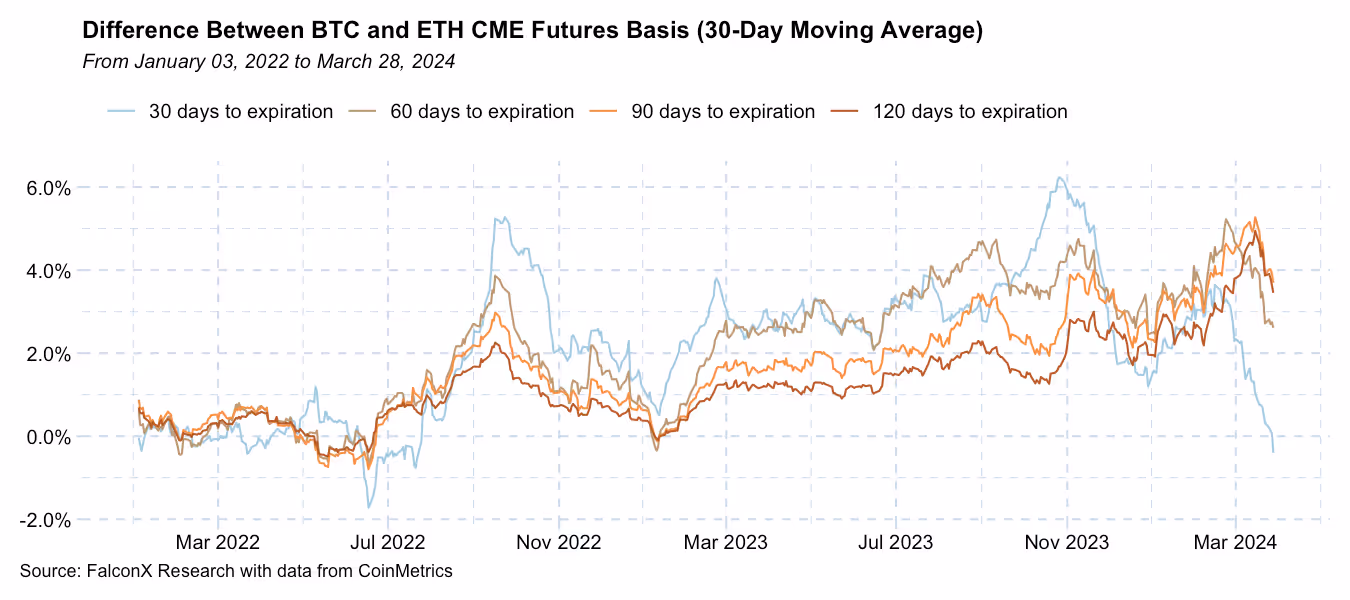
Notably, this trend shift occurred during a massive increase in market activity: Since the spot BTC ETFs launched on January 11, the CME open interest increased by 78% to $11.3 billion for BTC and by 67% to $1.3 billion for ETH.
What changed to break this trend?
One potential answer is that the introduction of spot BTC ETFs made executing the CME basis arbitrage for BTC easier. In the past, one would typically need exposure to both CME futures and BTC spot, which are not two easy markets to access at the same time: Many who have CME access can’t touch crypto directly, and not many who trade in crypto directly have the structure to access the CME.
After January 11, those with CME access can arbitrage the basis against spot BTC ETFs, which track BTC spot excellently.
Because this feature for now is only available for BTC, this could be a reason behind the BTC CME basis going lower than ETH’s despite the staking yield.
This matters because many institutional investors closely follow the CME basis and because, if true, it suggests that basis traders have been active on the buy side of spot BTC ETFs, potentially in size. If anything, it’s another reason to keep paying attention to relationships between the derivatives and spot markets in crypto.
Solios, Inc. and FalconX Delta, Inc. are registered as federal money services businesses with FinCEN. FalconX Bravo, Inc. is registered as a swap dealer with the U.S. Commodities Futures Trading Commission (CFTC) and is a member of the National Futures Association. FalconX Limited, FalconX Bravo, Inc., FalconX Delta, Inc., Falcon Labs Ltd., and Solios, Inc. are not registered with the Securities & Exchange Commission or the Financial Industry Regulatory Authority. FalconX Golf Pte. Ltd. is not required to be registered or licensed by the Monetary Authority of Singapore (MAS). MAS has granted FalconX Foxtrot Pte. Ltd. a temporary exemption from holding a license under the PSA for the payment services caught under the expanded scope of regulated activities for a specified period. FalconX Limited is licensed by the MFSA as a Class 2 Crypto-Asset Service Provider (Regulation (EU) 2023/1114). It is also licensed as a Financial Institution (Cap. 376) exclusively for EMT payment services. FalconX’s complaint policy can be accessed by sending a request to complaints@falconx.io
"FalconX" is a marketing name for the FalconX Group and its affiliates. Availability of products and services can be subjected to jurisdictional restrictions and operational capabilities of each FalconX entity. For information about which legal entities offer trading products and services, or if you are considering entering into a derivatives transaction, please reach out to your Sales or Trading representative.