Crypto Market in Wait-And-See Mode: Exploring Trend Breakout Indicators
Over the next few months, visibility on the election result and how this new macro regime will look should allow us to move past these two critical themes. Once visibility returns and the market resumes a more sustainable trend, the new capital entering or exiting the market will be a crucial variable.


After a relatively weak performance over the previous week, crypto prices recovered this week to roughly the same level before Labor Day weekend.
BTC is now back to brushing the $60k level and continues outperforming ETH. The ETH/BTC ratio is now a smidge above the 0.04 mark, the lowest since April 20, 2021. Among alts, the most prominent outperformers include TON and DOGE, which have partially recovered from a weak performance over the past few weeks. On the other hand, HNT led losses among assets with a circulating market cap of more than $1 billion.

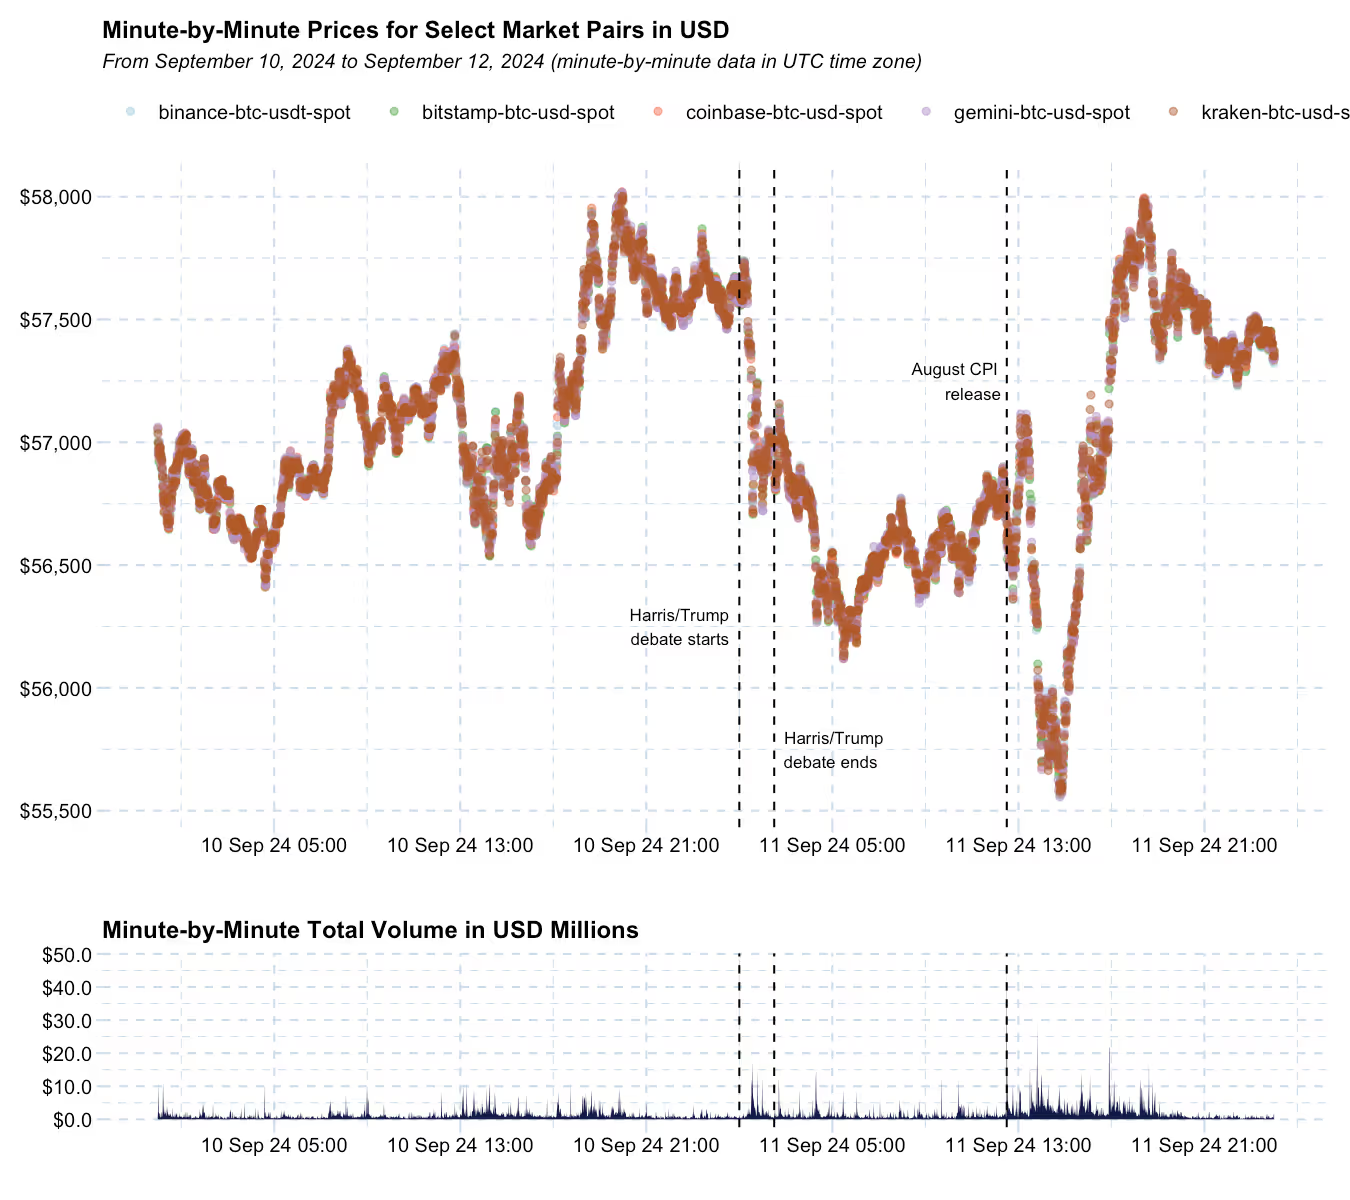
Two events pushed down crypto prices temporarily this week.
First, the 2024 presidential elections debate, which at least initially was seen as positive for the Harris campaign, had a clear short-term impact on crypto prices. When prices were recovering, the August CPI release, which came slightly hot on the core measure and reduced the likelihood of a 50bps cut next week, sent prices further down. From then on, however, crypto prices recovered somewhat quickly to their previous levels.
The chart below shows minute-by-minute USD prices and volumes for the main BTC pairs, along with the debate and the August CPI release times highlighted.
A few weeks ago, we showed how the relationship between crypto prices and election odds has been, at best, inconsistent. We also mentioned that this relationship would likely strengthen once we get closer to election day on November 5.
The chart below updates the previous analysis showing the relationship between changes in Republican win odds as measured by the crypto-powered application Polymarket and BTC prices. Gray dots represent the beginning of the election, red and blue dots show the period when Republicans or Democrats had momentum, and the black dots highlight the final stretch of the election cycle (after August 16).
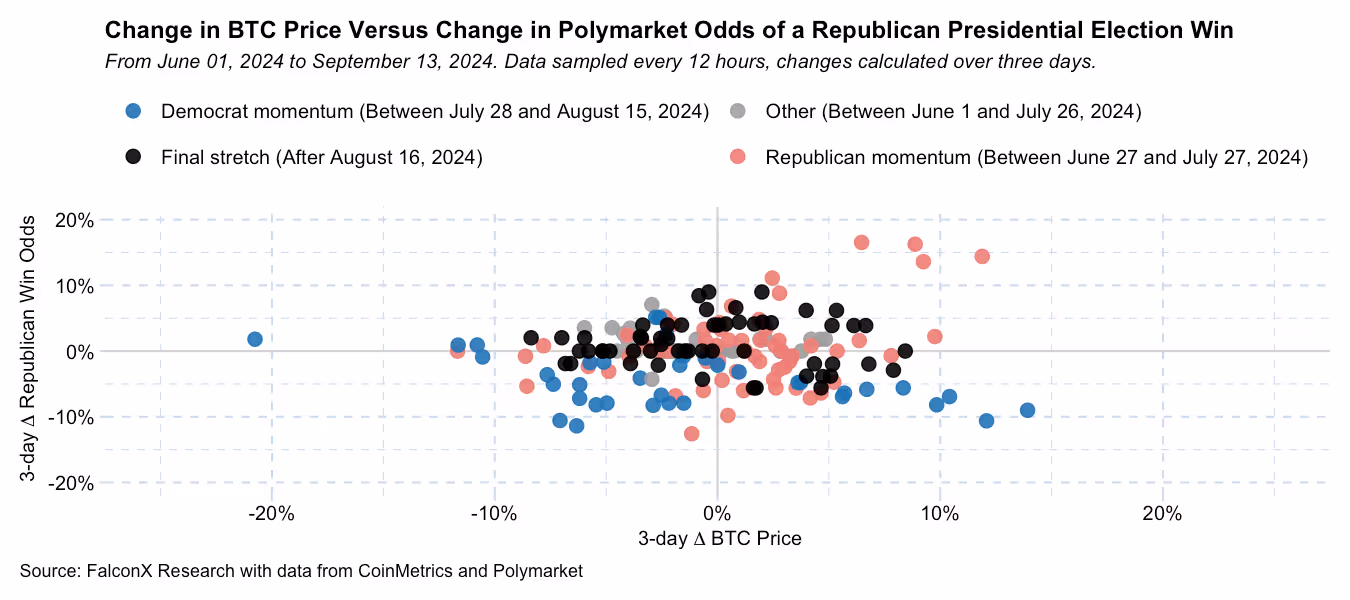
The black dots above, which refer to the past few weeks, show that there’s still an incipient, even if not entirely consistent, relationship between a Republican presidential election win and the BTC price. The next few weeks will be interesting, though, as meaningful parts of the industry are still giving the benefit of the doubt of a Harris administration becoming more crypto-friendly than the current stance of the executive and some key regulatory agencies.
Another critical driver impacting prices is the path of U.S. monetary policy and overall macro conditions. Correlations between BTC and the leading broad equity indices (S&P 500 and the Nasdaq) are approaching levels not seen since the mid-sized banking crisis in 2023.
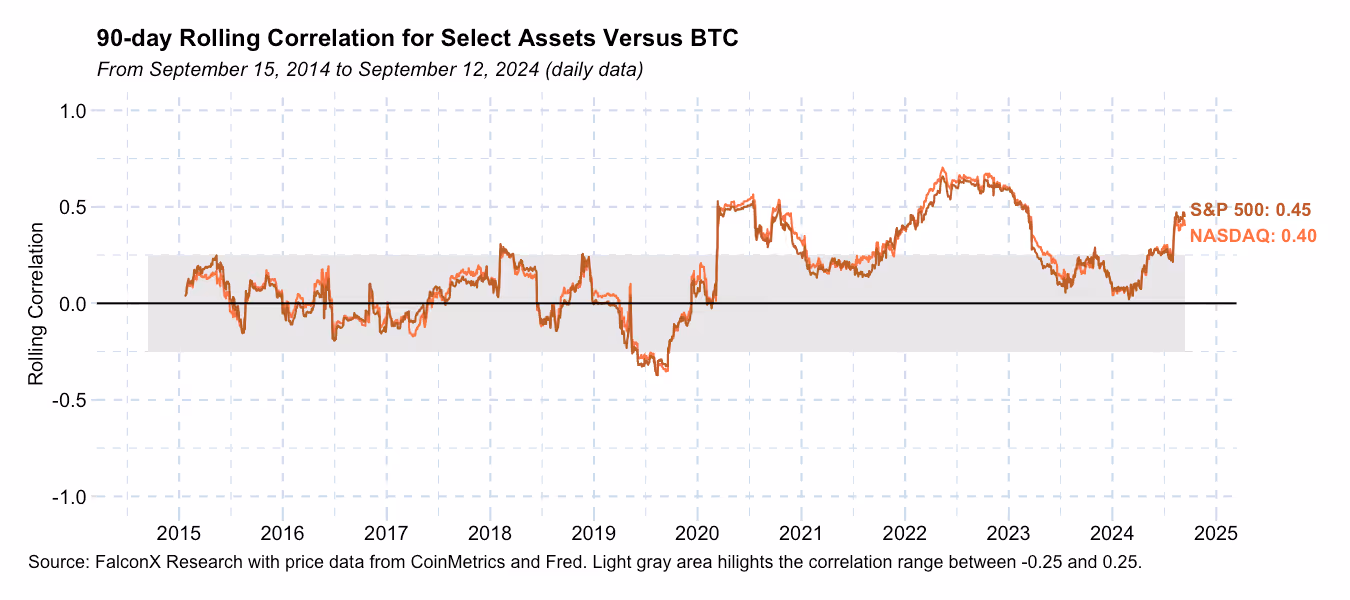
As we enter a rate-cutting cycle in next week’s FOMC meeting, the focus will likely shift from whether the first cut is 25 bps or 50 bps to the more critical question of how large and how long this cycle will be.
Over the next few months, visibility on the election result and how this new macro regime will look should allow us to move past these two critical themes.
Until then, however, short-term price movements are likely to wash out.
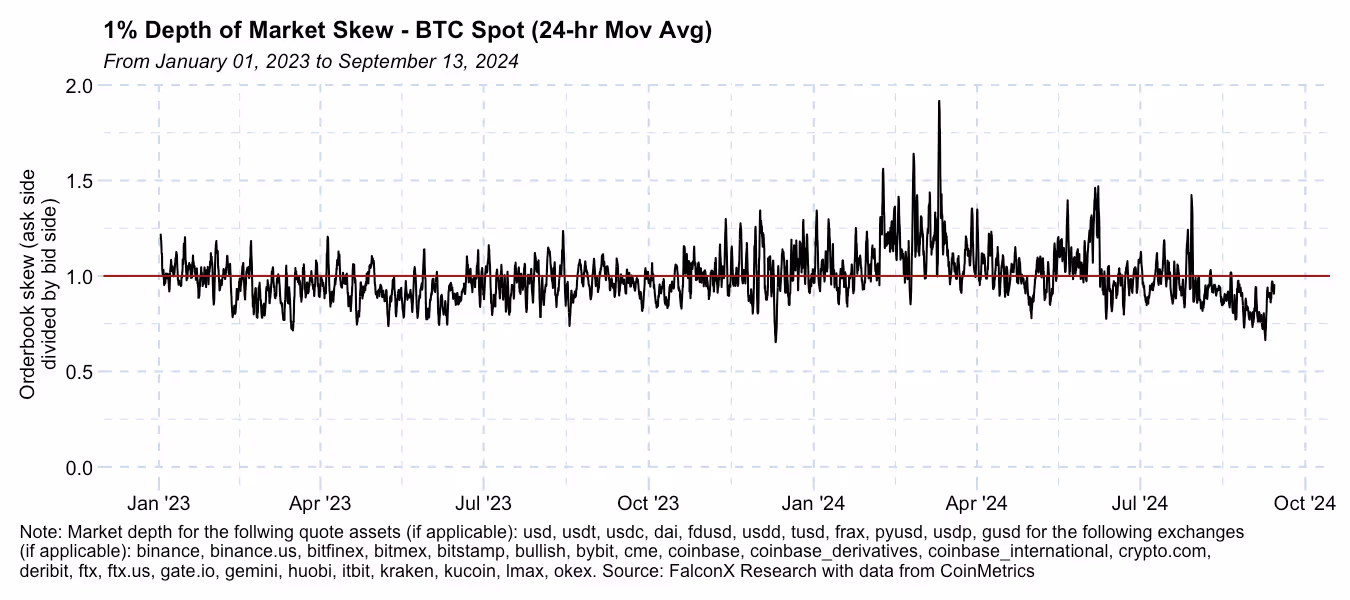
We have recently seen how short-term pressure has quickly exhausted itself, for example, in the skew of spot order books. During the most recent drop below the $56k level, the BTC orderbook became the most titled to the buy side in 2024. It is not surprising that we very quickly came back to the previous range.
Once visibility returns and the market resumes a more sustainable trend, the new capital entering or exiting the market will be a crucial variable.
The maturation of the market structure, an excellent trend, requires us to change how we measure capital flowing into or out of the market. For example, ETF flows have emerged as a critical source of flows into crypto, and stablecoins are increasingly used for other non-speculative use cases.
The stablecoin balance on centralized exchanges is one of the indicators that can help in this regard.
The first chart below shows the total stablecoin balance on centralized exchanges based on data from Artemis. Periods in which this balance grew by over 10% in the past 30 days are highlighted in green, while periods in which this balance declined by over 10% in the same period are highlighted in red. The BTC price is shown in the second chart to provide context to what that means for the crypto cycle.
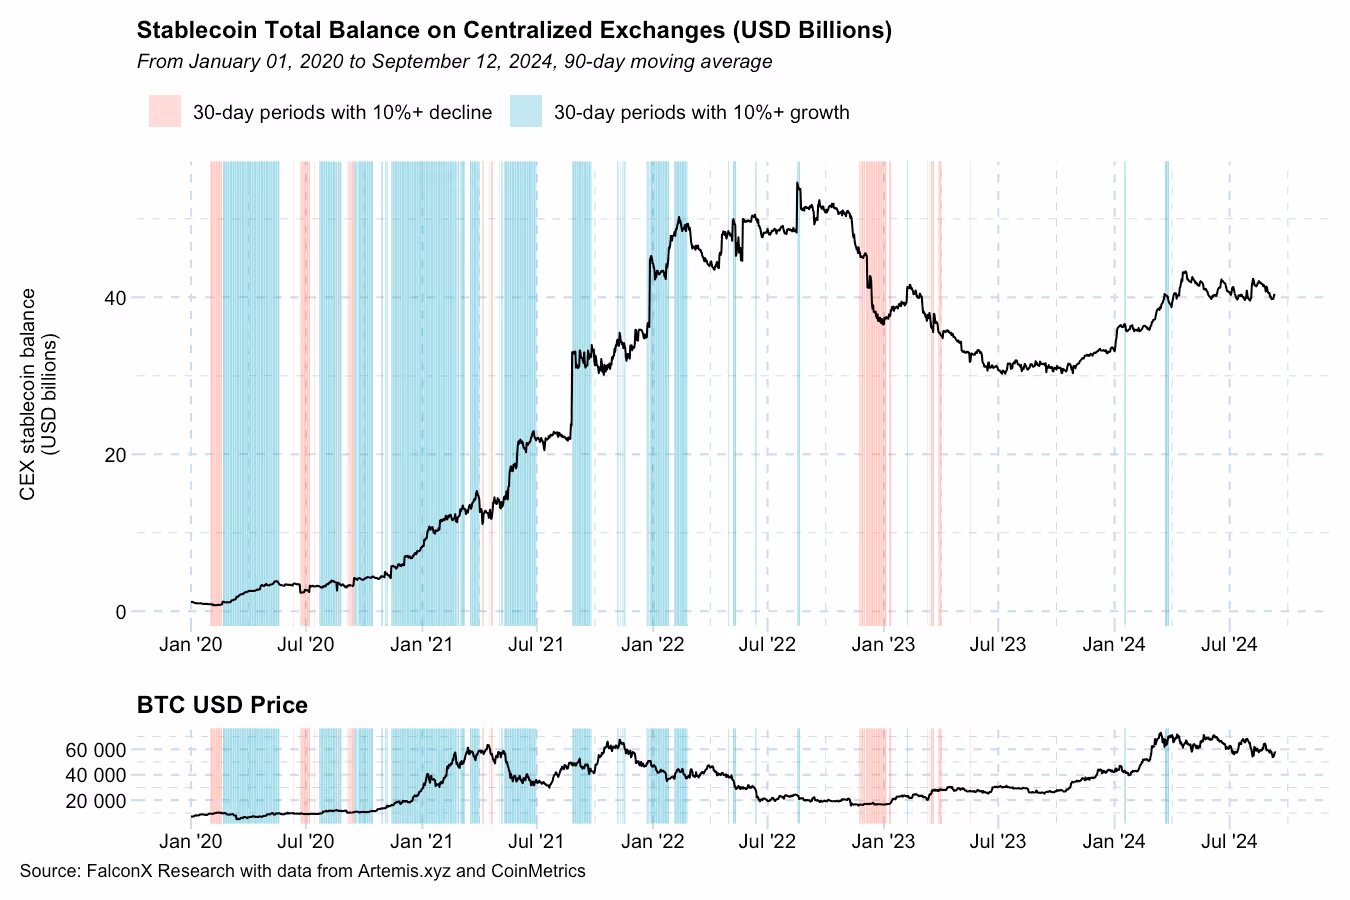
Aside from a few brief instances in 2024 right after the spot BTC ETF launch and when BTC broke new ATHs, it has been almost 18 months since stablecoin balances have grown more than 10% over 30 days. This aligns with the view that ETF and other flows were likely the main driver behind the price appreciation that started in October 2023.
It is important to remember that exchange-tagging data is not perfect (and can change over time as new addresses are discovered). Still, this is another indicator that might provide additional context when a broader trend in crypto price action is established.
This material is for informational purposes only and is only intended for sophisticated or institutional investors. Neither FalconX Limited, FalconX Bravo, Inc., FalconX Delta, Inc., FalconX Foxtrot Pte Ltd., FalconX Golf Pte Ltd., Solios, Inc., Falcon Labs, Ltd., KestrelX, Ltd., nor Banzai Pipeline Limited (separately and collectively “FalconX”) service retail counterparties, and the information on this website is NOT intended for retail investors. The material published on this website is not (i) an offer, or solicitation of an offer, to invest in, or to buy or sell, any interests or shares, or to participate in any investment or trading strategy, (ii) intended to provide accounting, legal, or tax advice, or investment recommendations, or (iii) an official statement of FalconX or any of its affiliates. Any information contained in this website is not and should not be regarded as investment research, debt research, or derivatives research for the purposes of the rules of the CFTC or any other relevant regulatory body.
Prior to entering into any proposed transaction, recipients should determine, in consultation with their own investment, legal, tax, regulatory, and accounting advisors, the economic risks and merits, as well as the legal, tax, regulatory and accounting characteristics and consequences of the transaction. Pursuant to the Dodd-Frank Act, over-the-counter derivatives are only permitted to be traded by "eligible contract participants" (“ECP”s) as defined under Section 1a(18) of the CEA (7 U.S.C. § 1a(18)). Do not consider derivatives or structured products unless you are an ECP and fully understand and are willing to assume the risks.
Solios, Inc. and FalconX Delta, Inc. are registered as federal money services businesses with FinCEN. FalconX Bravo, Inc. is registered with the U.S. Commodities Futures Trading Commission (CFTC) as a swap dealer and a member of the National Futures Association. FalconX Limited, FalconX Bravo, Inc., FalconX Delta, Inc., Falcon Labs Ltd., and Solios, Inc. are not registered with the Securities & Exchange Commission or the Financial Industry Regulatory Authority. FalconX Golf Pte. Ltd. is not required to be registered or licensed by the Monetary Authority of Singapore (MAS). MAS has granted FalconX Foxtrot Pte. Ltd. a temporary exemption from holding a license under the PSA for the payment services caught under the expanded scope of regulated activities for a specified period. FalconX Limited is a registered Class 3 VFA service provider with the Malta Financial Services Authority under the Virtual Financial Assets Act of 2018. FalconX Limited is licensed to provide the following services to Experienced Investors, Execution of orders on behalf of other persons, Custodian or Nominee Services, and Dealing on own account. FalconX’s complaint policy can be accessed by sending a request to complaints@falconx.io
"FalconX" is a marketing name for FalconX Limited and its affiliates. Availability of products and services is subject to jurisdictional limitations and capabilities of each FalconX entity. For information about which legal entities offer trading products and services, or if you are considering entering into a derivatives transaction, please reach out to your Sales or Trading representative.