Volumes and Orderbook Dynamics Suggest a Sideways Market in the Near Term
While liquidity trends are not leading indicators, they are excellent tools for confirming breakout trends and should be closely watched over the next few months.

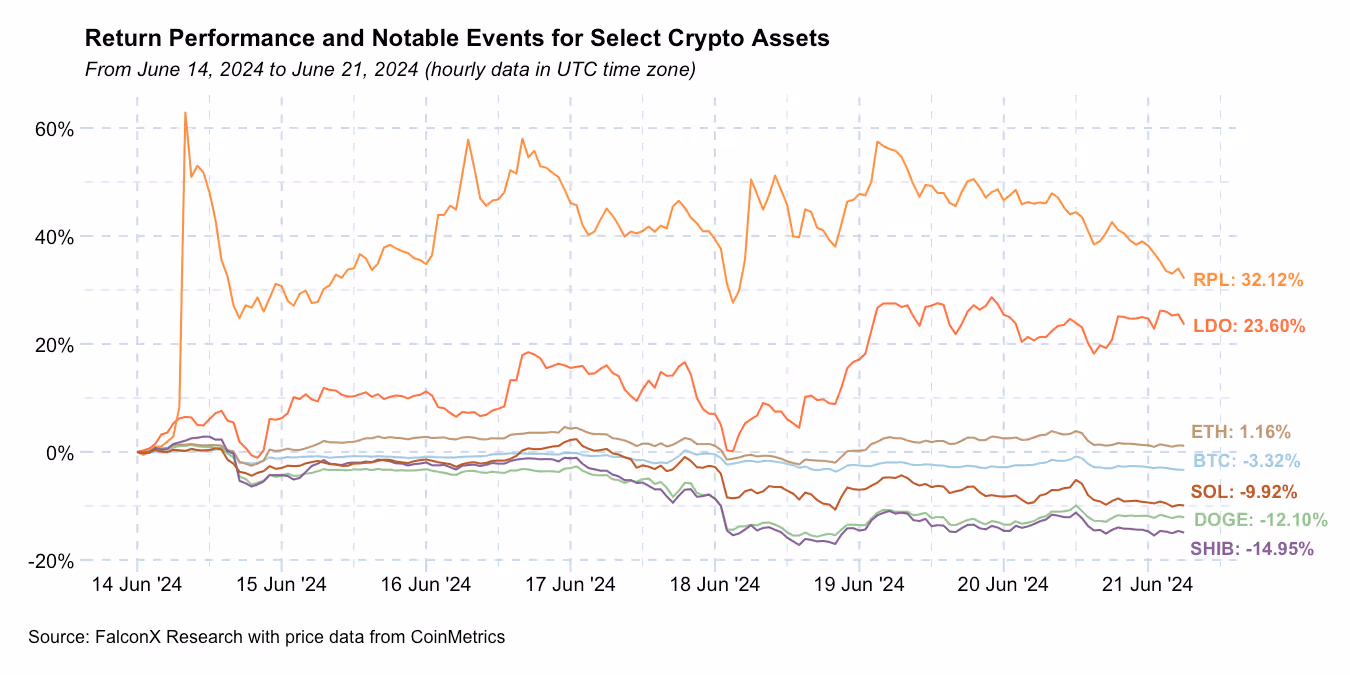
Crypto remained mostly in the red over the past seven days, with ETH slightly outperforming on the back of expectations that its spot ETFs could launch over the next couple of weeks and on the SEC notifying Ethereum development studio ConsenSys that it had dropped its investigation into Ethereum 2.0. Price action remains underpinned by weak volumes, as average daily BTC and ETH volumes are almost 50% and 40% lower in June versus March in the spot and futures markets, respectively.
Memecoins as a category continue to slide. SHIB and DOGE, with a circulating market cap of more than $10 billion, were among the largest drops within assets. On the other hand, liquid staking tokens (LSTs) LDO and RPL registered some of the highest gains as high-beta betas on the Ethereum ecosystem.
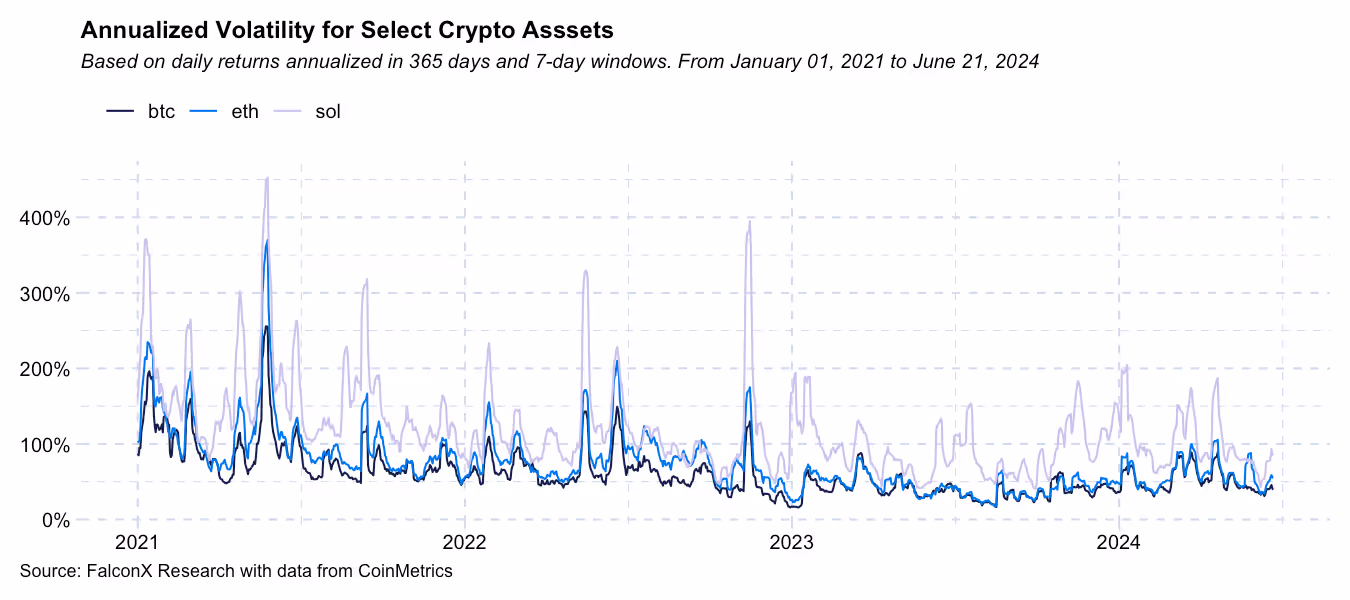
Majors continue to struggle to find a direction. BTC has rarely traded outside the range between $60k and $71k since April, and its seven-day realized annualized volatility stands now at only 39.4%. While ETH is now slightly outperforming BTC on a year-to-date basis, it has also been range-bound over the past month, and its realized volatility is at a relatively low 55.0%.
Liquidity trends once again remain critical to gain confidence that price rallies (or slumps) can be strong enough to break beyond the current range.
I’m closely monitoring two trends.
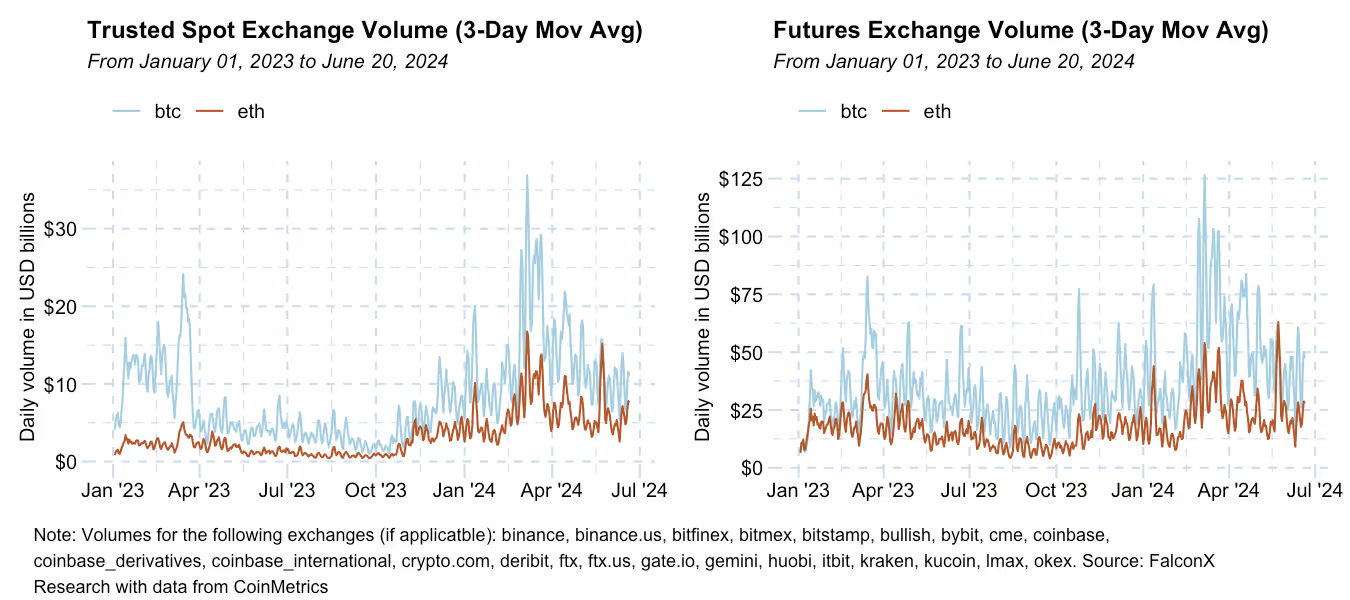
The first is volumes, which I have been highlighting as a decent proxy to confirm price trends on the ups and downs. As the chart below shows, both spot and futures volumes have been soft compared to the all-time highs achieved in March and thus are not pointing to any significant break of the current rage.
The notable trend in volumes is that ETH’s volumes are holding steadier than BTC’s since the unexpected approval of its spot ETF.
The second, perhaps more overlooked but equally important, liquidity indicator I’m watching is the behavior of spot orderbooks.
The charts below show the BTC and ETH 1% book depth (in USD on the left and native units on the right), with the ask side of the book showing positive values and the bid side showing negative values. Orderbook trends have not changed very often, but they have been consistently expanded over the past few months to reach the highest values in the past year.
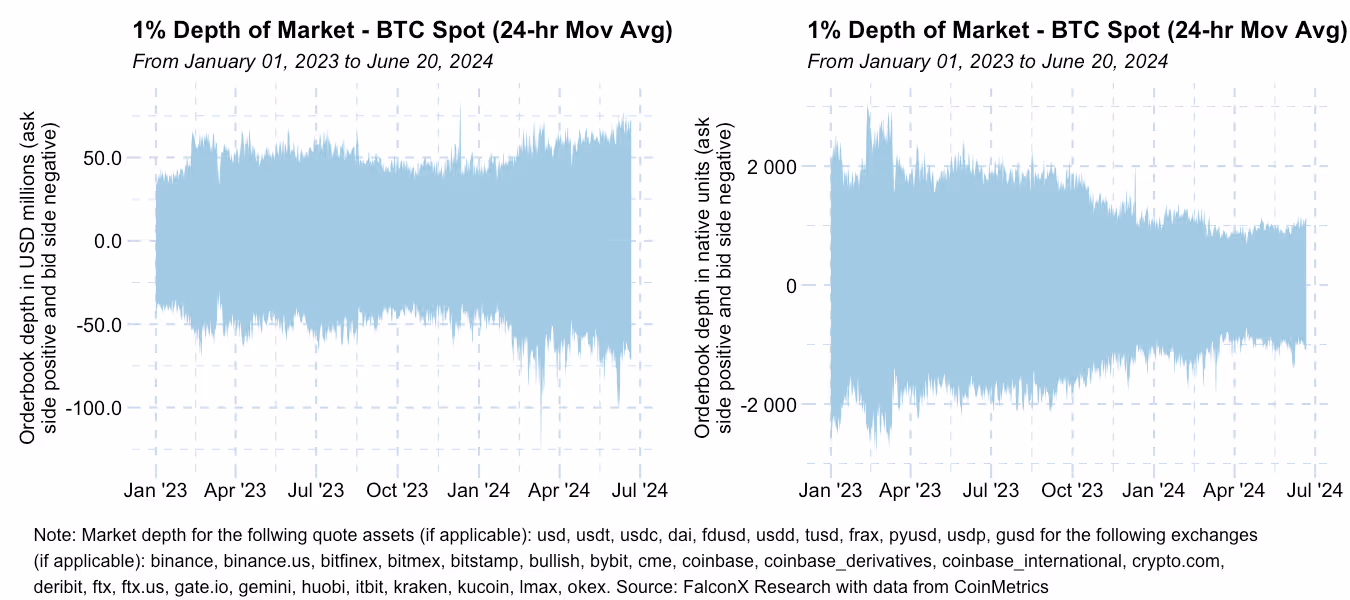
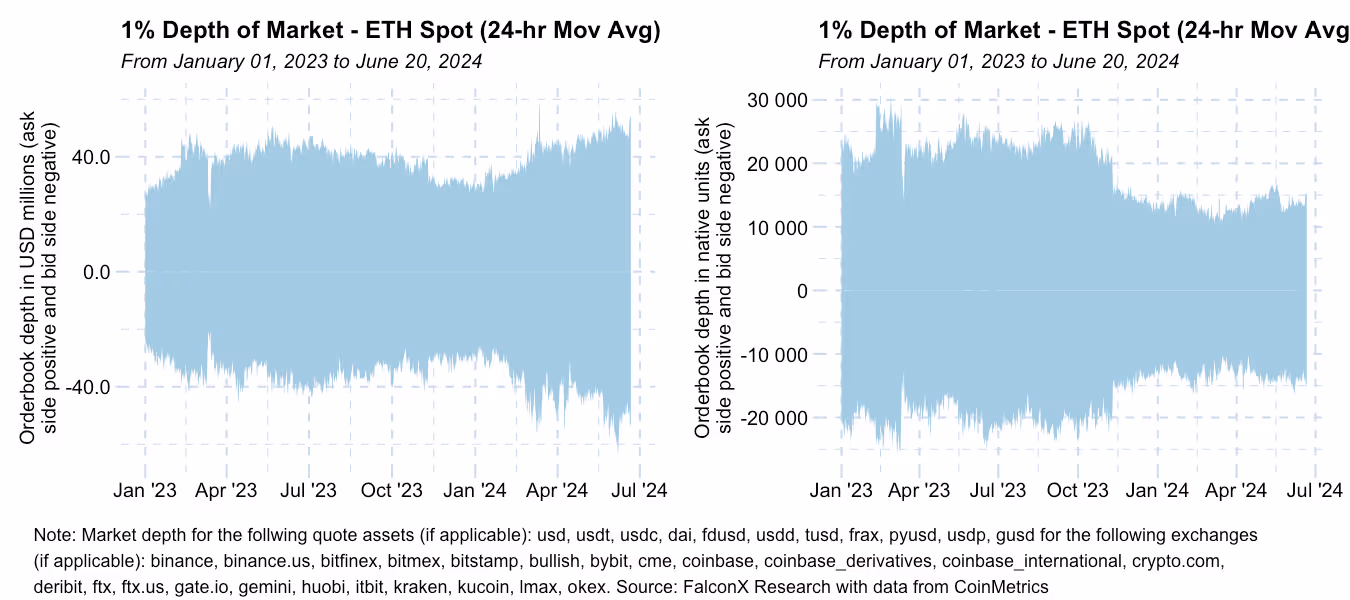
Surprisingly, this recent market depth expansion was not balanced across the two sides of the book.
The charts below show the orderbook skew, which can be read as the amount of sell pressure divided by the amount of buy pressure sitting on orderbooks within 1% of the mid-price. This indicator suggests relatively more sell pressure on the orderbook when it is above the 1 mark and more buy pressure on the orderbook when it is below 1.
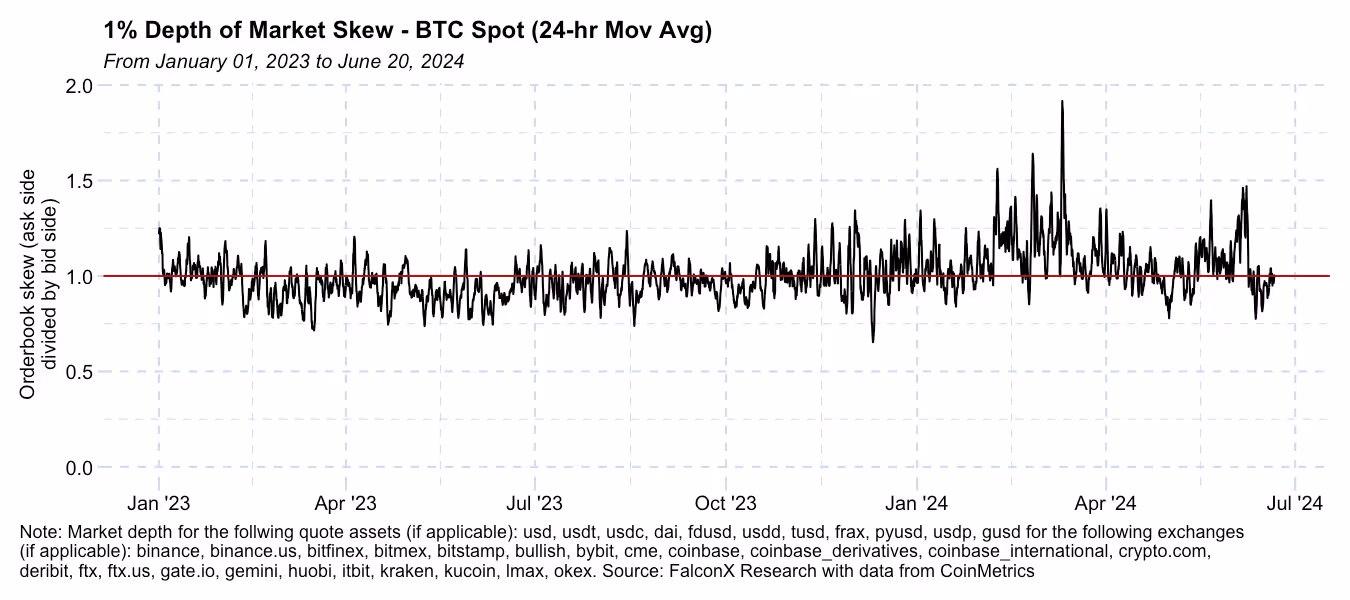

While the price rallies in the fourth quarter of 2023 were accompanied by a flat order book skew, the rallies in 2024 have seen increasing sell pressure (i.e., the lines above spiking up, especially for BTC).
My rule of thumb is that when the order book skew is unbalanced by more than 25% (i.e., the indicator above breaking over 1.25 or below 0.75), it's time to start watching for potential trend reversals. The skew approaching 50% (i.e., the indicator above breaking over 1.5 or below 0.5) is rare but has already happened four times in 2024 and was followed by sharp corrections.
The current market dynamic is characterized by low volatility, soft volumes, and orderbooks getting unbalanced when prices start to move to the edges of their range. This setup suggests a likely flat market in the near term.
Even if a relatively dull summer could be in store for crypto price action, some factors could shake things up in the second half of the year. Better visibility on when the Fed will start cutting rates, the outcome of the U.S. presidential election and its impact on the crypto industry, new trends in crypto ETF net flows, and other topics could introduce some volatility back into the market.
Whatever the catalyst, a breakout from the current range will likely be accompanied by strong volumes and relatively balanced order books. While liquidity trends are not leading indicators, they are excellent tools for confirming breakout trends and should be closely watched over the next few months.
Other Trends We're Watching
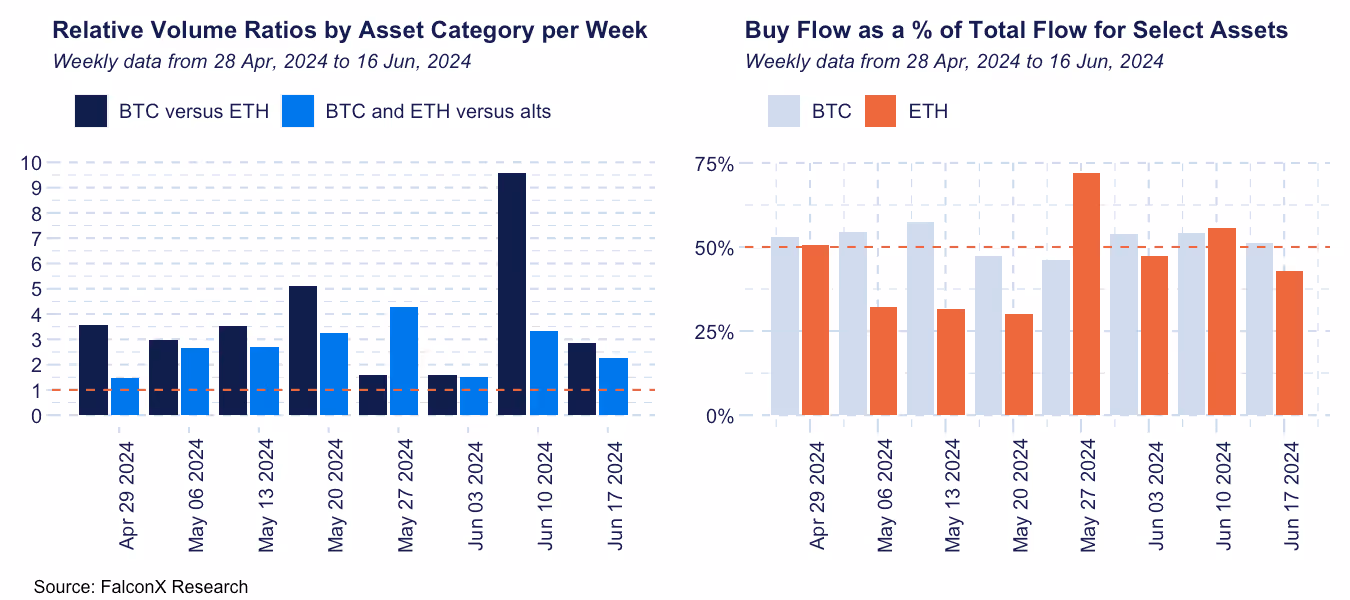
FalconX Trading Desk Color: Most client personas have been better sellers at our desk, except for prop trading desks, which were slightly tilted to better buyers. BTC and ETH flow continue to dominate investor activity, and BTC buy/sell ratios have been slightly higher than ETH’s. Alts activity remains concentrated in relatively few assets, with names such as SOL, UNI, and AVAX attracting mostly sell flow while names such as DOGE and CRV attracted buy flow.
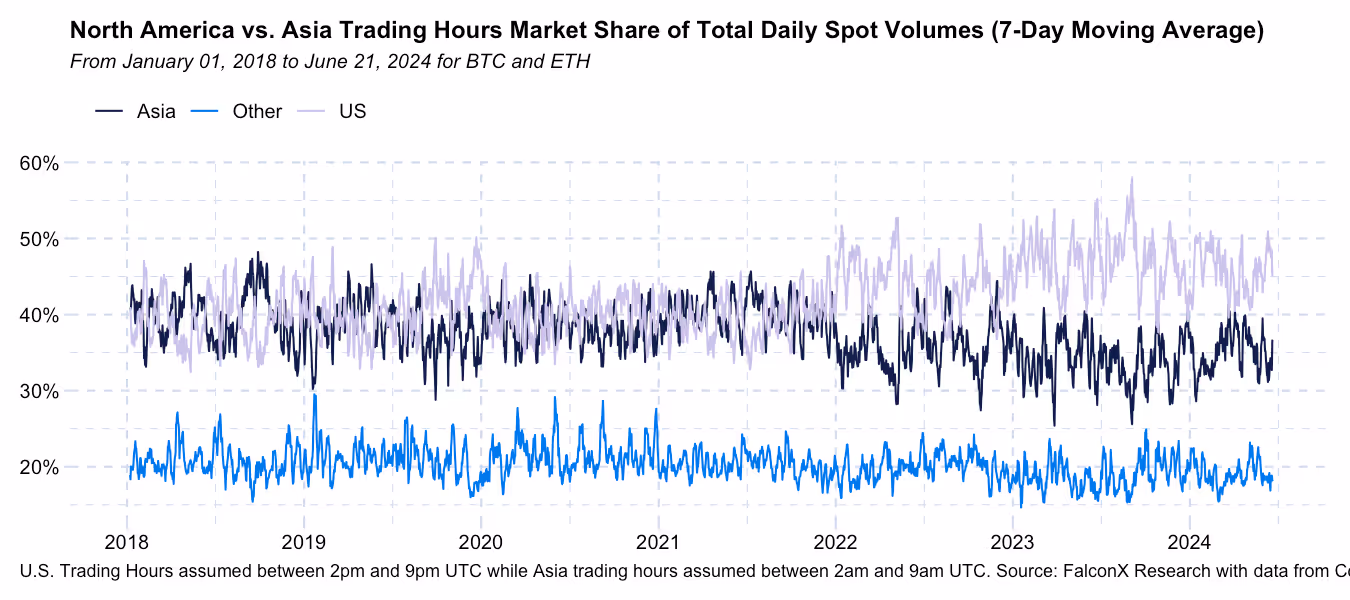
U.S. Flows Continue to Drive Price Action: The share of BTC and ETH spot volumes (seven-day moving average) during U.S. hours climbed back to the 45-50% level after reaching a 2024 low of below 40%. At the same time, volumes during Asian market hours retrenched to about 35% from 40% over the past few months. This trend highlights how, despite most of the crypto spot volume trading on international exchanges, the centrality of U.S. news flow has been driving most of the market price action.
The Coinbase premium, which has been strongly correlated with the overall market direction in 2024, highlights the same trend.
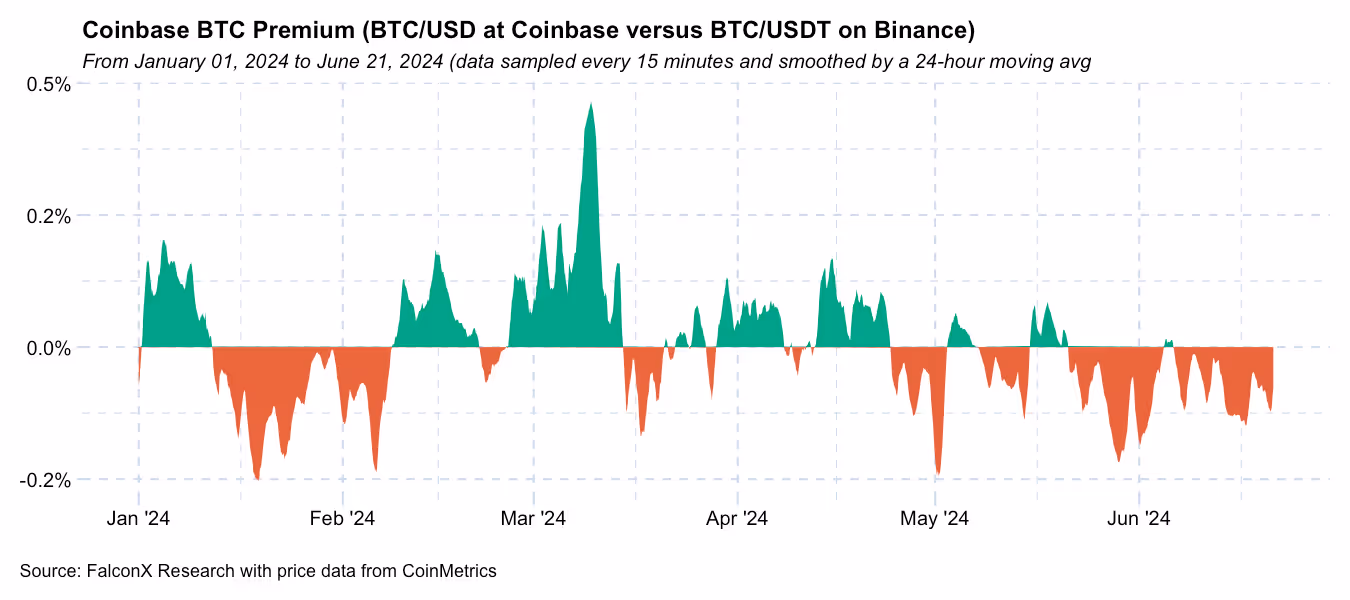
Most potential industry triggers are related to U.S. factors, such as the path of monetary policy, elections, and trends in ETF net flows. As a result, I expect American flows to keep leading overall market action.
This material is for informational purposes only and is only intended for sophisticated or institutional investors. Neither FalconX Limited, FalconX Bravo, Inc., FalconX Delta, Inc., FalconX Foxtrot Pte Ltd., FalconX Golf Pte Ltd., Solios, Inc., Falcon Labs, Ltd., KestrelX, Ltd., nor Banzai Pipeline Limited (separately and collectively “FalconX”) service retail counterparties, and the information on this website is NOT intended for retail investors. The material published on this website is not (i) an offer, or solicitation of an offer, to invest in, or to buy or sell, any interests or shares, or to participate in any investment or trading strategy, (ii) intended to provide accounting, legal, or tax advice, or investment recommendations, or (iii) an official statement of FalconX or any of its affiliates. Any information contained in this website is not and should not be regarded as investment research, debt research, or derivatives research for the purposes of the rules of the CFTC or any other relevant regulatory body.
Prior to entering into any proposed transaction, recipients should determine, in consultation with their own investment, legal, tax, regulatory, and accounting advisors, the economic risks and merits, as well as the legal, tax, regulatory and accounting characteristics and consequences of the transaction. Pursuant to the Dodd-Frank Act, over-the-counter derivatives are only permitted to be traded by "eligible contract participants" (“ECP”s) as defined under Section 1a(18) of the CEA (7 U.S.C. § 1a(18)). Do not consider derivatives or structured products unless you are an ECP and fully understand and are willing to assume the risks.
Solios, Inc. and FalconX Delta, Inc. are registered as federal money services businesses with FinCEN. FalconX Bravo, Inc. is registered with the U.S. Commodities Futures Trading Commission (CFTC) as a swap dealer and a member of the National Futures Association. FalconX Limited, FalconX Bravo, Inc., FalconX Delta, Inc., Falcon Labs Ltd., and Solios, Inc. are not registered with the Securities & Exchange Commission or the Financial Industry Regulatory Authority. FalconX Golf Pte. Ltd. is not required to be registered or licensed by the Monetary Authority of Singapore (MAS). MAS has granted FalconX Foxtrot Pte. Ltd. a temporary exemption from holding a license under the PSA for the payment services caught under the expanded scope of regulated activities for a specified period. FalconX Limited is a registered Class 3 VFA service provider with the Malta Financial Services Authority under the Virtual Financial Assets Act of 2018. FalconX Limited is licensed to provide the following services to Experienced Investors, Execution of orders on behalf of other persons, Custodian or Nominee Services, and Dealing on own account. FalconX’s complaint policy can be accessed by sending a request to complaints@falconx.io
"FalconX" is a marketing name for FalconX Limited and its affiliates. Availability of products and services is subject to jurisdictional limitations and capabilities of each FalconX entity. For information about which legal entities offer trading products and services, or if you are considering entering into a derivatives transaction, please reach out to your Sales or Trading representative.

.png)