What Can Spot ETF Flows Tell Us About the Trajectory of Bitcoin Prices? A Preliminary Statistical Investigation
While ETF flows may not provide a crystal ball for Bitcoin price predictions, they offer meaningful context for interpreting market trends and potential directional movements.

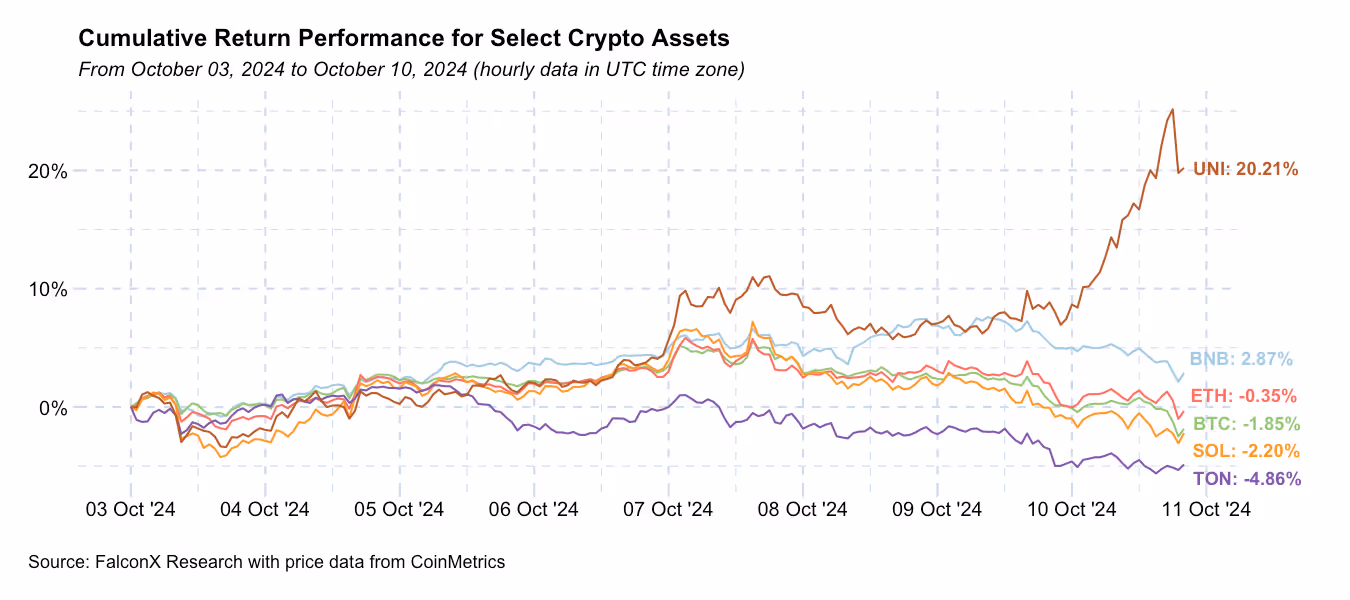
The anticipated "Uptober" bull run has failed to materialize in the first ten days of the month. The uncertainty surrounding China's market-boosting policies, further exacerbated by a mixed September CPI report, brought in some bearishness. However, calls for a successful soft landing engineered by the Fed brought some excitement toward the end of the week.
As a result, BTC has dipped below $60,000 for the first time since September 18, but it recovered to positive territory like most of the market. The notable exception among cryptocurrencies with a market cap exceeding $1 billion was UNI, which saw gains following Uniswap Labs' announcement of Unichain, a DeFi-specific Ethereum L2.
In the coming months, we expect greater clarity on two key factors currently preventing the market from establishing a clearer directional trend: the outcome of the U.S. 2024 elections and the outlook for global liquidity conditions. For those interested in our detailed analysis of these topics, please refer to our previous reports (here, here, and here).
As uncertainty surrounding these factors diminishes, ETF flows may reemerge as a more significant driver of price action.
Since their launch on January 11, U.S. BTC spot ETFs have accumulated $18.6 billion in net flows. Excluding GBTC outflows, total net inflows now approach $40 billion. While 70% of these non-GBTC inflows occurred between January and March, a remarkable $11.8 billion entered during the relatively flat market period after April. This sustained interest, even in a stagnant market, underscores the growing importance of ETFs as the main source of new capital to the market.
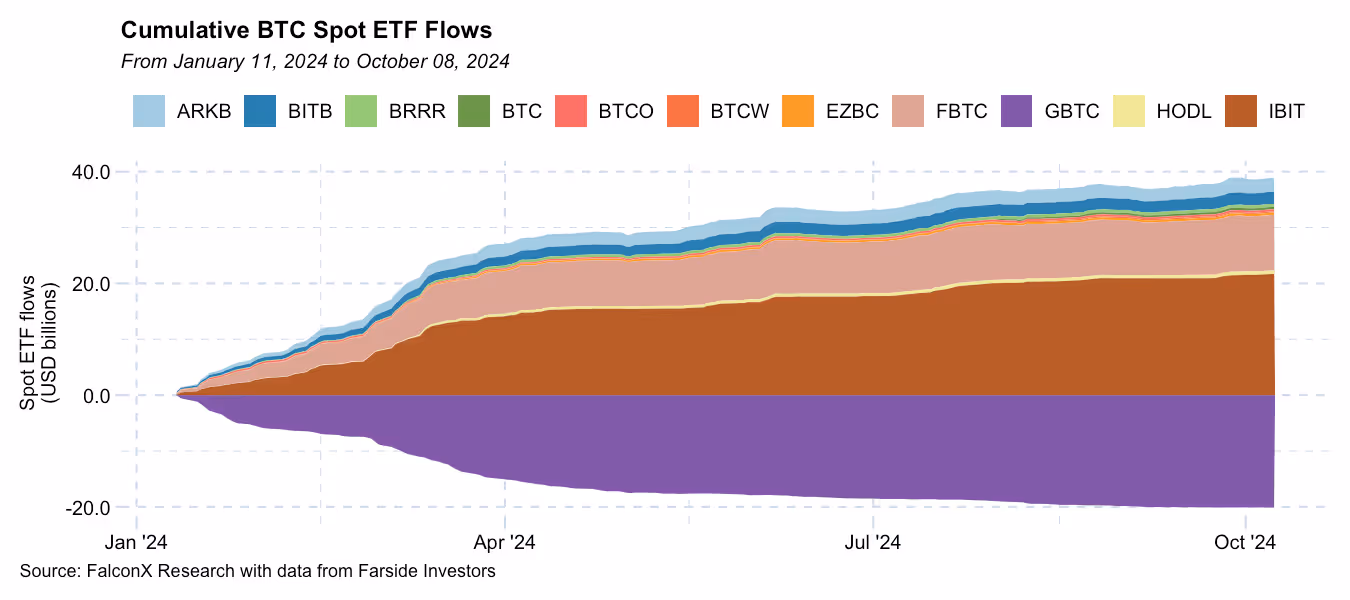
Unsurprisingly, total net inflows have been stronger during months with positive price performance. Over the past six months, Bitcoin posted gains in May, July, and September. During these months, ETF net flows were substantial: $2.1 billion, $3.2 billion, and $1.3 billion, respectively.
The interplay between U.S. spot ETF net flows and Bitcoin prices has been largely unexplored until now. With ten months of daily data available and the market potentially approaching a more defined direction in the coming months, this is an opportune time to delve deeper into understanding this relationship.
We’ll get a bit wonky on the stats side, but bear with me because the conclusions are potentially interesting.
The chart below compares two metrics: Change in daily BTC prices versus the variation in U.S. spot ETF flows. Both are computed over 7-day periods to reduce short-term noise. Notably, ETF flows variations are calculated using the normalized difference method, which better accounts for its constant shifts between positive and negative values.

There is a statistically significant relationship between changes in ETF flows and prices, but it’s not a strong one. The correlation coefficient is 0.30, which means that less than 10% of the change in prices can be explained by the change in net flows.
This relationship, however, is far from constant. The chart below shows the correlation coefficient between the variation in ETF flows and prices on a rolling 60-day basis. This figure has ranged from 0.10 to just north of 0.50 over the past ten months.

The relationship between ETF flows and Bitcoin prices has been strengthening in recent weeks. Given that ETFs have been the primary source of new capital into the crypto market in 2024, this correlation may continue to intensify if the market finds a sustainable direction.
The critical question for most investors, however, is whether ETF flows provide meaningful context for interpreting the trajectory of prices.
One way to address this question is what is known as the Granger causality test, which helps determine if one time series is useful in forecasting another. In this case, we're examining how helpful changes in ETF flows are for predicting the BTC price.
This test’s results (f-statistic of 8.4767 with a p-value of 0.00406) indicate that there’s a strong relationship between these two variables at a statistically significant level considering the most common thresholds of 0.05 and 0.01.
Importantly, Granger causality doesn't prove actual causation. It merely indicates that one variable (ETF flows) contains information that precedes and helps predict changes in another variable (Bitcoin price).
But in practical terms, these results suggest that ETF flows do indeed provide valuable context for understanding Bitcoin price movements beyond what we could predict using past price data alone.
To deepen our understanding of the relationship between ETF flows and Bitcoin price changes, we employed a Vector Autoregression (VAR) model in conjunction with an Orthogonal Impulse Response Function analysis. These tools are particularly useful for examining the dynamic interactions between multiple time series variables.
Our analysis reveals intriguing dynamics between Bitcoin ETF flows and price movements.
The Vector Autoregression (VAR) model shows that Bitcoin prices exhibit strong momentum, with yesterday's price changes significantly influencing today's (coefficient: 0.802). More importantly, we found that previous day's ETF inflows positively impact today's price changes (coefficient: 0.027), confirming that ETF activity does influence Bitcoin's market behavior. ETF flows also show persistence (coefficient: 0.533), suggesting trends in inflows or outflows tend to continue.
To visualize these effects, we modeled how a sudden increase in ETF flows impacts Bitcoin prices over time using an Orthogonal Impulse Response Function. The chart below illustrates the response of BTC price changes to a shock in U.S. Spot BTC ETF flows over a 10-day horizon. The blue line represents the estimated price change, while the shaded area indicates the 95% bootstrap confidence interval.

The chart shows that a positive shock to ETF flows leads to a persistent positive effect on Bitcoin prices, peaking around days 3-4 with approximately a 1.2% price increase before gradually diminishing.
In sum, ETF flows demonstrate short-term predictive power for Bitcoin price movements, while a feedback loop suggests price increases may temporarily dampen ETF inflows, potentially acting as a stabilizing force. Both price changes and ETF flows exhibit momentum effects, indicating persistence in trends.
While the magnitude of the price change (around 1.2% at its peak) may seem modest, it’s important to highlight that there was no negative impact observed in the impulse response function. This suggests that while ETF flows may not predict the exact size of price movements, they can be a useful tool for anticipating the direction of price changes.
It is important to acknowledge the limitations of these statistical analyses. Crypto market dynamics can be highly non-linear and complex, and the relatively short history of BTC spot ETFs limits the size of our dataset. Finally, these models also assume stationarity in the time series data, an assumption that may not hold for a volatile asset like BTC.
However, while ETF flows may not provide a crystal ball for Bitcoin price predictions, they offer meaningful context for interpreting market trends and potential directional movements. This information, combined with other market indicators, can contribute to a more comprehensive understanding of Bitcoin price dynamics in the current market environment.
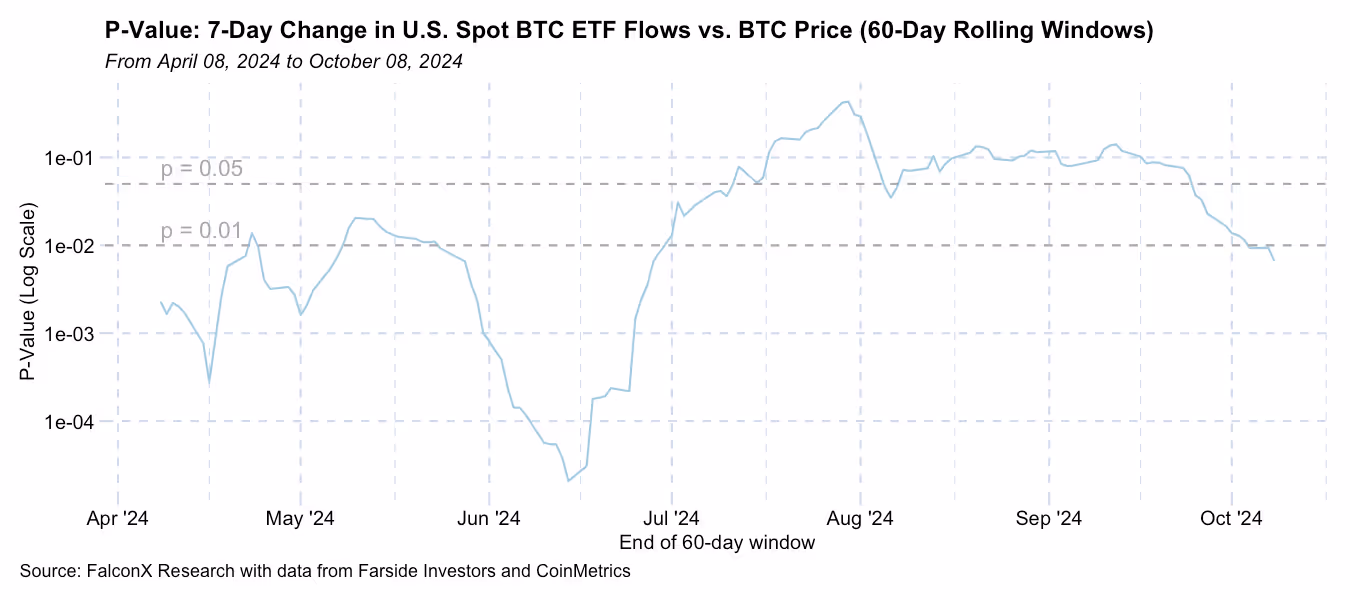
PS: For stats enthusiasts curious about the statistical significance of the relationship between ETF flows and BTC prices over time, the chart displays p-values calculated using 60-day rolling windows. Lower p-values indicate stronger statistical significance.
Notably, periods with p-values below 0.05 (5% significance level) suggest a statistically significant relationship. At times, the p-value drops below 0.01, indicating significance at the 1% level. These periods of high statistical significance likely correspond to stronger correlations between ETF flows and BTC prices.
This material is for informational purposes only and is only intended for sophisticated or institutional investors. Neither FalconX Limited, FalconX Bravo, Inc., FalconX Delta, Inc., FalconX Foxtrot Pte Ltd., FalconX Golf Pte Ltd., Solios, Inc., Falcon Labs, Ltd., KestrelX, Ltd., nor Banzai Pipeline Limited (separately and collectively “FalconX”) service retail counterparties, and the information on this website is NOT intended for retail investors. The material published on this website is not (i) an offer, or solicitation of an offer, to invest in, or to buy or sell, any interests or shares, or to participate in any investment or trading strategy, (ii) intended to provide accounting, legal, or tax advice, or investment recommendations, or (iii) an official statement of FalconX or any of its affiliates. Any information contained in this website is not and should not be regarded as investment research, debt research, or derivatives research for the purposes of the rules of the CFTC or any other relevant regulatory body.
Prior to entering into any proposed transaction, recipients should determine, in consultation with their own investment, legal, tax, regulatory, and accounting advisors, the economic risks and merits, as well as the legal, tax, regulatory and accounting characteristics and consequences of the transaction. Pursuant to the Dodd-Frank Act, over-the-counter derivatives are only permitted to be traded by "eligible contract participants" (“ECP”s) as defined under Section 1a(18) of the CEA (7 U.S.C. § 1a(18)). Do not consider derivatives or structured products unless you are an ECP and fully understand and are willing to assume the risks.
Solios, Inc. and FalconX Delta, Inc. are registered as federal money services businesses with FinCEN. FalconX Bravo, Inc. is registered with the U.S. Commodities Futures Trading Commission (CFTC) as a swap dealer and a member of the National Futures Association. FalconX Limited, FalconX Bravo, Inc., FalconX Delta, Inc., Falcon Labs Ltd., and Solios, Inc. are not registered with the Securities & Exchange Commission or the Financial Industry Regulatory Authority. FalconX Golf Pte. Ltd. is not required to be registered or licensed by the Monetary Authority of Singapore (MAS). MAS has granted FalconX Foxtrot Pte. Ltd. a temporary exemption from holding a license under the PSA for the payment services caught under the expanded scope of regulated activities for a specified period. FalconX Limited is a registered Class 3 VFA service provider with the Malta Financial Services Authority under the Virtual Financial Assets Act of 2018. FalconX Limited is licensed to provide the following services to Experienced Investors, Execution of orders on behalf of other persons, Custodian or Nominee Services, and Dealing on own account. FalconX’s complaint policy can be accessed by sending a request to complaints@falconx.io
"FalconX" is a marketing name for FalconX Limited and its affiliates. Availability of products and services is subject to jurisdictional limitations and capabilities of each FalconX entity. For information about which legal entities offer trading products and services, or if you are considering entering into a derivatives transaction, please reach out to your Sales or Trading representative.

.png)