Macro factors continue to drive crypto price action, with the FOMC meeting taking center stage this week. While some market participants remain divided on whether the Fed delivered a dovish or hawkish message, risk assets responded positively regardless.
The dovish interpretation stems from the fact that 11 of 19 policymakers still project two interest rate cuts in 2025, despite some officials reducing their forecasts to a single cut. During the press conference, Chair Powell reassured the markets that the overall economy is in good shape and the Fed can afford to wait for more clarity.
Macro uncertainties persist, however. The Summary of Economic Projections (SEP) revealed a sharp deterioration in forecasts for 2025 economic growth, employment, and inflation indicators. The Fed also signaled lower confidence in these projections, with risks skewed to the downside.
Against this backdrop, both majors and alts closed the week in positive territory for the first time in several weeks. BTC underperformed relative to other large-cap cryptocurrencies (those with circulating market capitalization exceeding $10 billion), while ETH emerged as the third-strongest performer among this group.
Nevertheless, the ETH/BTC price ratio remains near multi-year lows. Currently, this ratio has traded lower only 11% of the time since 2018 and stands just 30% above its lowest level in the period.

This chart spans a very long time frame for crypto standards.
One of the burning questions among investors is whether we’ll see ETH recover in the foreseeable future. While some prominent investors are excited with the vibe shift that is happening in Ethereum circles, others see more structural problems in the Ethereum ecosystem.
This is a long and complex discussion, but my goal here is to determine whether X/Twitter mindshare and sentiment data can be a helpful factor to anticipate a potential ETH recovery.
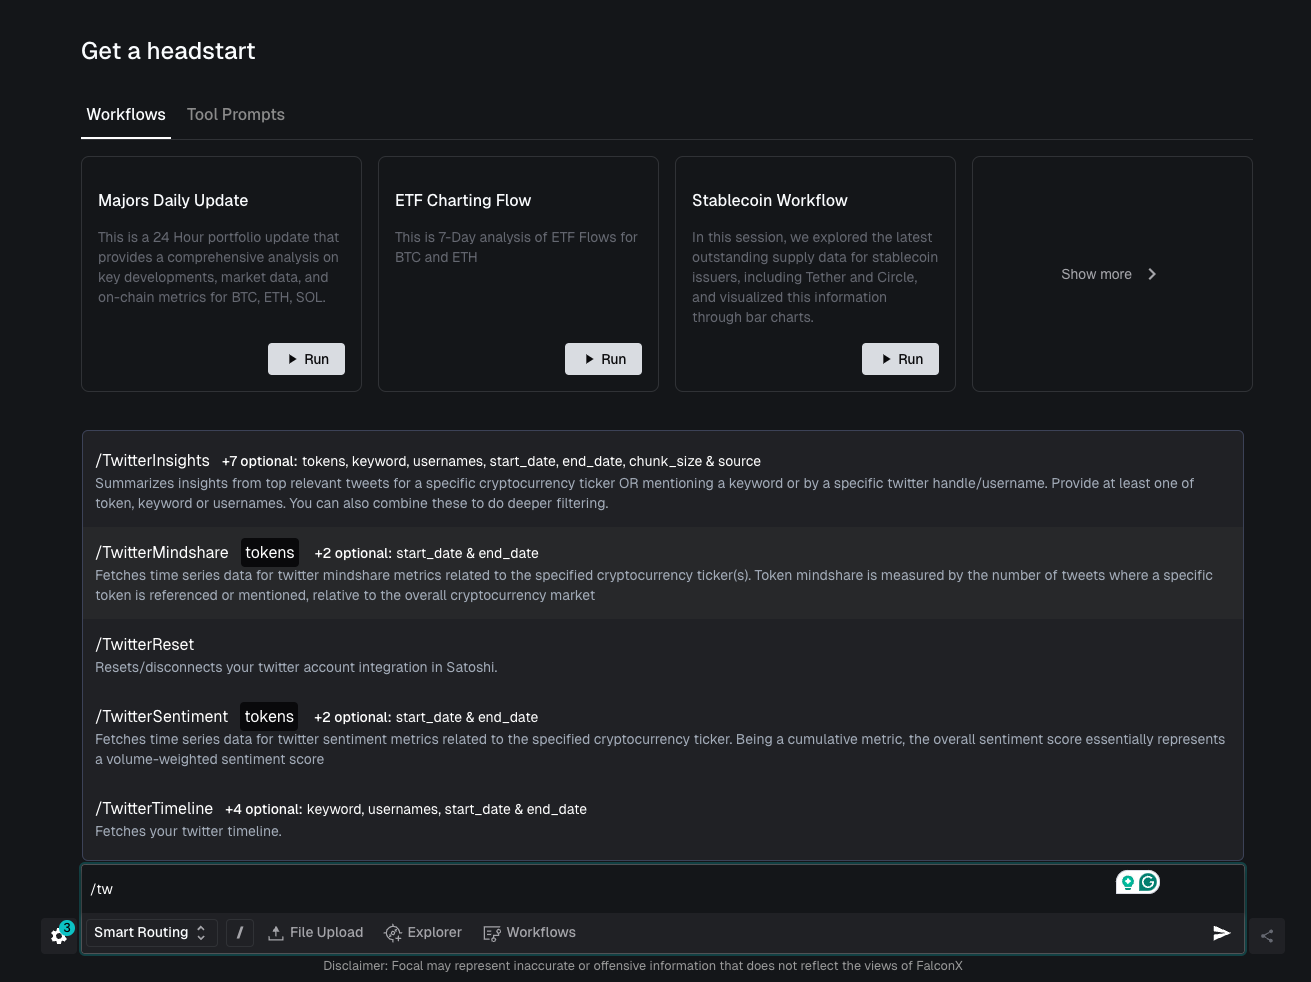
FalconX recently launched Focal, a generative AI tool to analyze markets. Focal was developed with enterprises in mind, built with zero data retention policies and powered by data from the top providers in the industry, such as Kaito, Token Terminal, Tokenomist (former Token Unlocks), CoinGecko, and others.
I’ve been using Focal extensively over the past few quarters and usually get asked how I leverage it in my day-to-day work. For today’s piece, I’m also going to take this opportunity to show a little more how I use generative AI.
I’ll use Kaito sentiment data for ETH and SOL. I’m adding SOL to this analysis to have another asset that burst into the crypto mainstream consciousness as ETH started to underperform, therefore getting some relative mindshare. The performance of the SOL/ETH ratio over the past few years illustrates this phenomenon.

I start asking Focal to look for data on X/Twitter mindshare and sentiment for ETH and SOL, starting on January 1, 2023. This data is sourced by Kaito, one of my favorite places to track narratives and sentiment in the various crypto ecosystems.
(For those taking notes, I’m using the /TwitterMindshare and /TwitterSentiment commands and just need to provide the list of tokens I’m looking for and the analysis period.)
The charts below show the data returned by Focal, with mindshare data on the left and sentiment data on the right for ETH (lightly blue) and SOL (brown). These visualizations provide the raw data that feeds into the statistical models discussed later.
A few trends are already immediately clear, such as how SOL’s mindshare has caught up with ETH’s over the past couple of years. Also, it’s evident how some key market events shaped sentiment in those assets, such as the optimism around the spot ETH ETF launch and the pessimism around SOL’s recent botched memecoin launches.

But the interesting question is whether this information can help inform an investment decision.
The next step is asking Focal to conduct statistical tests that explore the relationship between X/Twitter mindshare, sentiment, and token prices for these two assets. All I needed to do was to provide a few lines describing my dataset and inform Focal of my preferred programming language.
Let’s now look at the results, starting with SOL and then moving to ETH. I’m focusing on 90-day changes in mindshare, sentiment, and price in order to eliminate short-term noise.
Bear with me on the statistical wonkiness, as the results are potentially interesting.
Statistical tests for SOL’s mindshare, sentiment, and price showed that mindshare dominates sentiment. The relationship is substantial: changes in mindshare can explain up to 36% of the price variance using a simple linear model with a highly significant p-value (p < 2e-16). Using a more sophisticated model that captures non-linear effects called GAM (Generalized Additive Model) leads to an even stronger explanatory effect of 46%, which is an exceptional result for financial processes.
For ETH, the linear model produced by Focal shows some statistical significance, especially for sentiment data (p=0.00284, indicating a very low probability that this relationship occurred by chance), but a relatively weak predictive power. Focal, however, was smart enough to devise a GAM model (Generalized Additive Model, which allows for complex curved relationships rather than just straight lines), which is better at capturing non-linear relationships, and found that the model explains up to 25% of the variance of returns, which is notably high for finance.
Interestingly, causality tests show that sentiment can be used as a predictor for ETH prices, which was not as much the case for mindshare and SOL prices.
What does all this complicated statistical chatter say?
Comparing the models for both tokens reveals an interesting contrast: SOL's price movements are better explained by our models (46% vs. 25% for ETH), suggesting that social media data might be a stronger indicator for SOL than for ETH. This could reflect differences in their respective investor communities and market dynamics.
That said, ETH’s price action is more influenced by sentiment, while SOL is more influenced by mindshare. Critically, causality tests show that sentiment can be used as a factor to help predict the ETH price, which was not the case in the relationship between mindshare data and SOL prices.
Given the unique nature of crypto returns (ie, lack of stationarity, which makes it hard to fit into regular time series models), this is somewhat hard to fit into a formal model. It’s also important to keep in mind that market dynamics in this industry can shift significantly and abruptly and long-held relationships can break.
Still, this preliminary statistical analysis suggests that sentiment is one data point that can be used as a predictor for future ETH price action, likely in the context of a broader set of indicators. The 25% explanatory power means we can explain about a quarter of ETH's price movements using sentiment data - which is notable but still leaves 75% explained by other factors.
.png)